Why Julia?
我非常希望能有一個像 Matlab 的 programming tools:
- Cross platform (Windows, Mac, Linux)
- Free and very easy to install and launch (Matlab 顯然既非 free 也不容易 install 和 launch)
- 非常直覺的數學格式 (scaler and vector) 支持 (Python is out!)
- 支持 math symbol or unicode symbol, 最好是 code 而不是 comment (e.g. Jupiter)
- 完整的 library, e.g. linear algebra, DSP, distribution, etc.
- 非常重要是 graphics 的功能! e.g. Matlab, Matlibplot,
Julia 是我很看好的 candidate. 不過 Julia 有幾個問題:
- Syntax 變化快:Julia 0.7 之前 support “linspace()”, 後來完全不 support!! 這讓很多舊 code 無法直接使用。同時影響 Copilot 之類 AI low code, no code 在 Julia 的有用性。
- 同一個功能有不同 packages. 例如 plot 有四五種不同 packages: PyPlot, Plots, Gadfly(?)
Latex Math Symbols
In the Julia REPL and several other Julia editing environments, you can type many Unicode math symbols by typing the backslashed LaTeX symbol name followed by tab. (e.g. \pi [tab])
Plots
第一個問題是要用 PyPlot or Plots package! 建議使用 PyPlot 因爲和 Matlab, Python 的使用經驗一致!
PyPlot: Plot sin with axis/range
1 | |
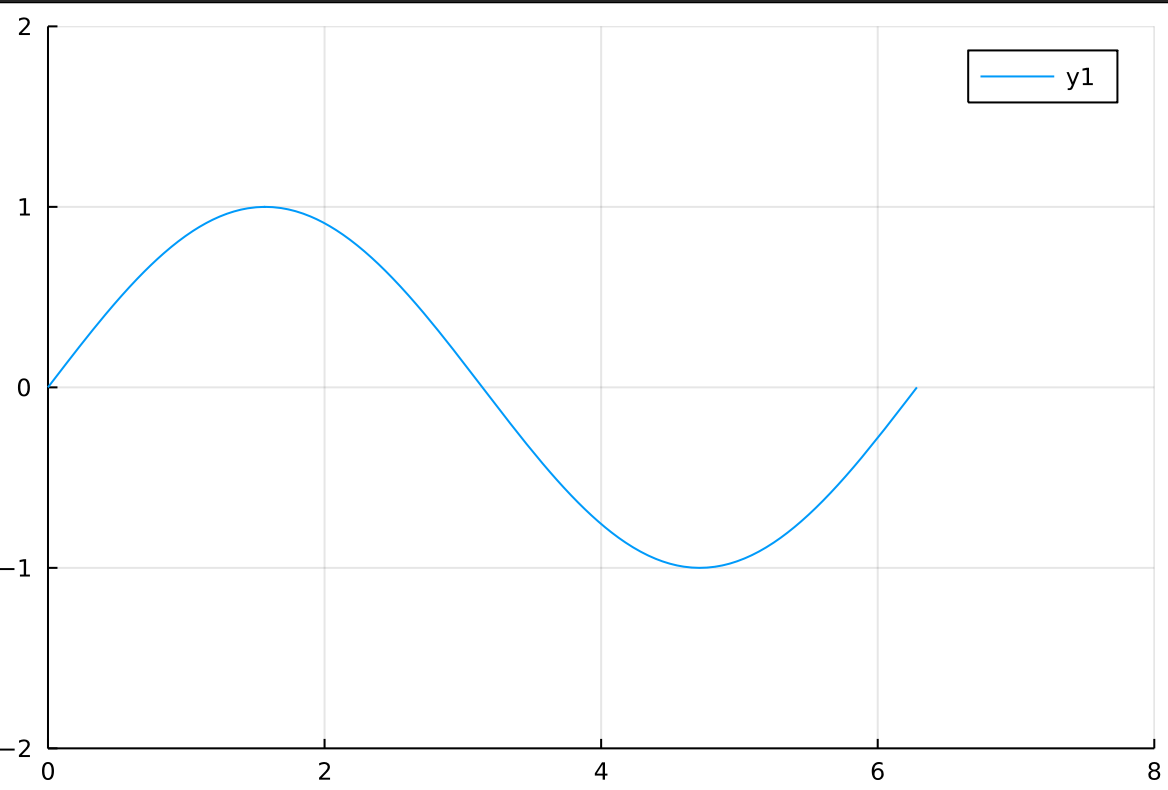
Plots: Plot sin with axis/range
1 | |
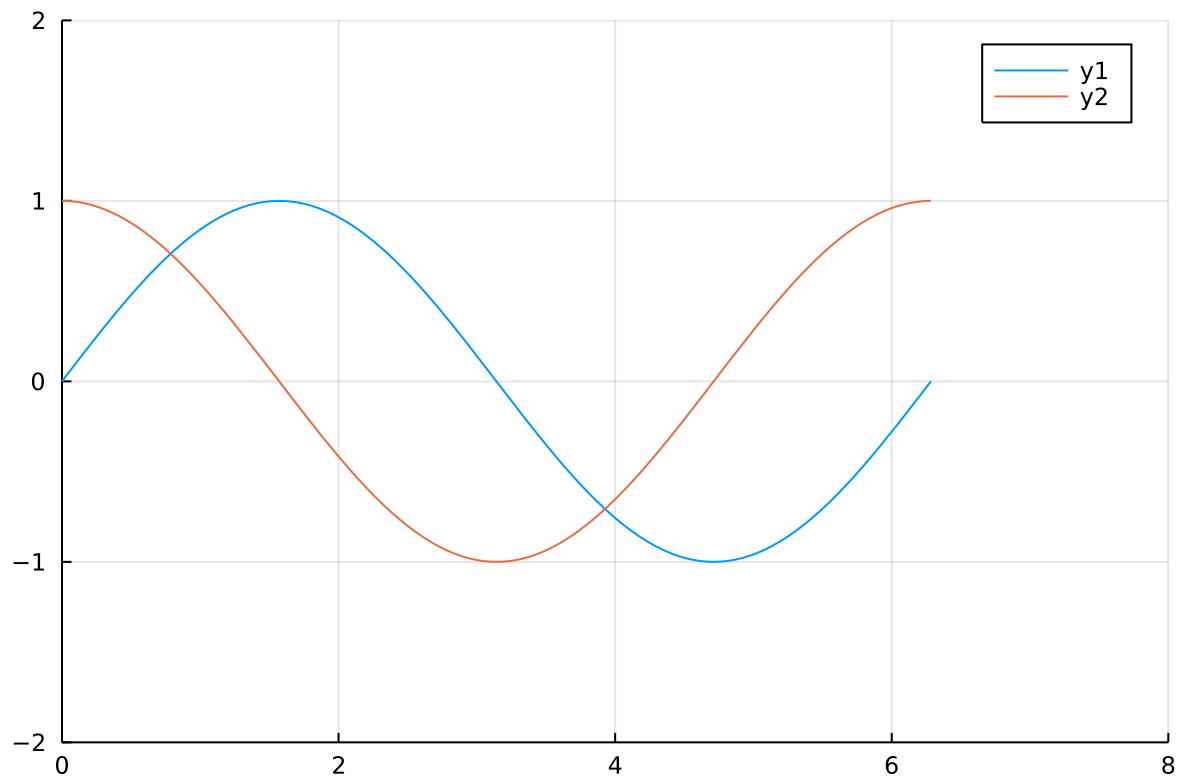
Plots: Add a new curve
1 | |
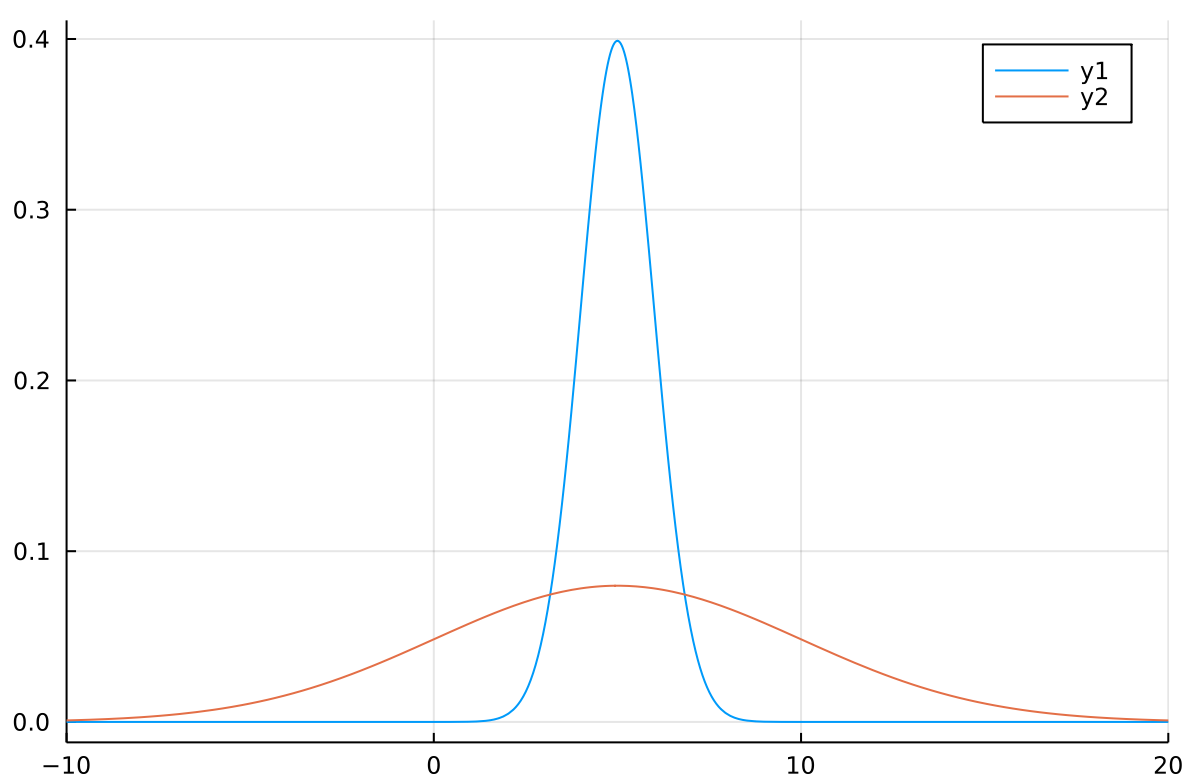
Plot normal distribution
1 | |
Amend:
Plots 好像更 general? 可以看 backend 是否是 PyPlot 決定是否用:
1 | |
Plots 如果在 VS code 不 work, 可以強迫 display
1 | |