如何避免 L2-norm or layer norm FP16 overflow or underflow
馬克士威電磁方程和狹義相對論的相容性
Static Data Crawler
Introduction
下一步想要用 Copilot 做幾件事
-
寫一個 data crawler 從 Geekbench 抓 (static) webpage in html. 我想先以 benchmark 網站例如: Geekbench (CPU), GFXbench (GPU), Antutu (Overall), Ethz (NPU) 爲主。
-
抓來的 html 用 BeautifulSoup parsing 需要的 content
-
BeatifulSoup parsed content 再用 regular expression 取出 structured data
-
Structured data 放入 database
-
database 可以 query and output formatted data
當然是用 Python 做爲 programming language
Step 1 & 2: Data Crawler and HTML Parsing
參考:[@weiyuanDataCrawler2016] and [@oxxoWebCrawler2021]
資料爬蟲是用在沒有以檔案或是 API 釋出資料集的情況下。這個時候就只能捲起袖子,自己想要的資料自己爬!
第一類比較簡單,是靜態網頁
靜態網頁
所謂的靜態網頁,表示網頁是在 Server-side 就已經產生回來的,所以你看的網頁上的資料是固定的(除非重新要求 Server-side)。這樣時候,我們可以來解析一下那資料,網頁,瀏覽器,是怎麼被串起來的呢?一般來說流程是這樣:
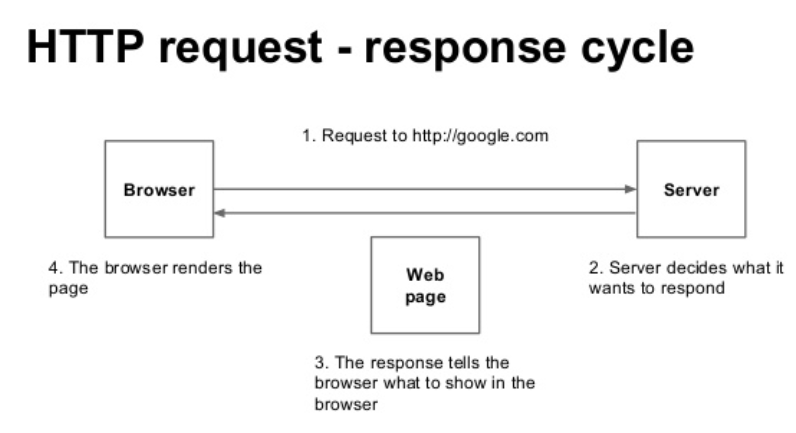
- 使用者(Client-side)發出請求,稱為是 Request。
- 伺服器(Server-side)收到請求,根據請求處理後回應,稱為是 Response。
- 產生的回應如果是純資料的話,屬於 API 的一種;如果是網頁的話,就會回傳一個包含 HTML 標籤的網頁格式。
- 瀏覽器接收包含 HTML 標籤的網頁格式,呈現網頁給使用者。
以上就是一個網頁形成及溝通的過程。網路爬蟲,簡單來說,就是模擬使用者的行為,把資料做一個攔截的動作。基本上可以簡化為:
- [模擬 Request] -> [攔截 Response] -> [從 Response 整理資料] -> [done!]
CoPilot for Data Crawler and Html Parse
Input: create a data crawler to crawl the data from a static website and save the data to a local file.
The default weblink 是極客學院。The data crawler works!
- Request 成功並且回傳 html
-
這裏是用 beautifulsoup4 (bs4) 用來 parse html. bs4 在 anaconda 環境是 default, 不需要另外 install.
-
Title 是 “脚本開發中的 3D 數學”
- Link 有 extract 出 html 所有的 links.
大約花了 1 小時。
# create a data crawler to crawl the data from a static website
# and save the data to a local file

import requests
from bs4 import BeautifulSoup
import os
import re
import time
import random

# get the html content of the website
def get_html(url):
    try:
        r = requests.get(url, timeout=30)
        r.raise_for_status()
        r.encoding = r.apparent_encoding
        return r.text
    except:
        return "Error"

# get the title of the website
def get_title(html):
    soup = BeautifulSoup(html, 'html.parser')
    title = soup.find('title').text
    return title

# get the content of the website
def get_content(html):
    soup = BeautifulSoup(html, 'html.parser')
    content = soup.find('div', class_ = 'content')
    return content

# get the links of the website
def get_links(html):
    soup = BeautifulSoup(html, 'html.parser')
    links = soup.find_all('a', href = re.compile(r'^/'))
    return links

# save the data to a local file
def save_data(url, title, content):
    path = 'data/'
    if not os.path.exists(path):
        os.mkdir(path)
    with open(path + title + '.txt', 'w', encoding = 'utf-8') as f:
        f.write(url + '')
        f.write(title + '')
        if content:
            f.write(content.text)

# main function
def main():
    url = 'http://www.jikexueyuan.com/course/494.html'
    html = get_html(url)
    title = get_title(html)
    content = get_content(html)
    save_data(url, title, content)
    links = get_links(html)
    for link in links:
        print(link)
        time.sleep(random.random() * 5)

if __name__ == '__main__':
    main()
接著我把 weblink 改成 geekbench android single core (SC) benchmark. 基本 ok, 有一些小修改:
- url = ‘https://browser.geekbench.com/android-benchmarks’
- title 可能無法直接作爲 file name 因爲其中包含 space, \n, etc. 所以我加了 process_title to replace special characters to underscore.
1 | |
HTML 資料整理
參考:[@jPythonCrawler2019] and [@fishYahooShopping2018]
從 HTML 標前中整理資料的行為叫做 Parse HTML,所使用的工具稱為 HTMLParser ,在 Python 主流是 BeautifulSoup 這套。BeautifulSoup 會把資料處理後存在變數。接下來可以使用一些函式,把想要值取出來。以下幾個是官方列出來常見的用法,細節可以看這邊。
基本的 search, find functions
find: return ?
Find_all: return ?
基本的取值 function
-
string:用來獲取目標路徑下第一個非標籤字元串,得到的是個字元串 (string)
-
strings:用來獲取目標路徑下所有的子孫非標籤字元串,返回的是個生成器 (generator)
-
stripped_strings:用來獲取目標路徑下所有的子孫非標籤字元串,會自動去掉空白字元串,返回的是一個生成器
-
get_text:用來獲取目標路徑下的子孫字元串,返回的是字元串(包含HTML的格式內容)
-
text:用來獲取目標路徑下的子孫非標籤字元串,返回的是字元串
這裡補充說明一下,如果獲取到的是生成器,一般都是把它轉換成list,不然你看不出那是什麼玩意
另外我找到一個非常有用的 HTML Online Viewer, 可以 expand/collapse html 對於看清楚結構非常有用!HTML Online Viewer
後來發覺 Chorme 本身的 inspect 就非常厲害。[@fishYahooShopping2018]
Geekbench HTML
Geekbench website Geekbench 5 - Cross-Platform Benchmark -> Browser -> Benchmark Charts -> Android Benchmark Chart. 基本看起來如下圖:
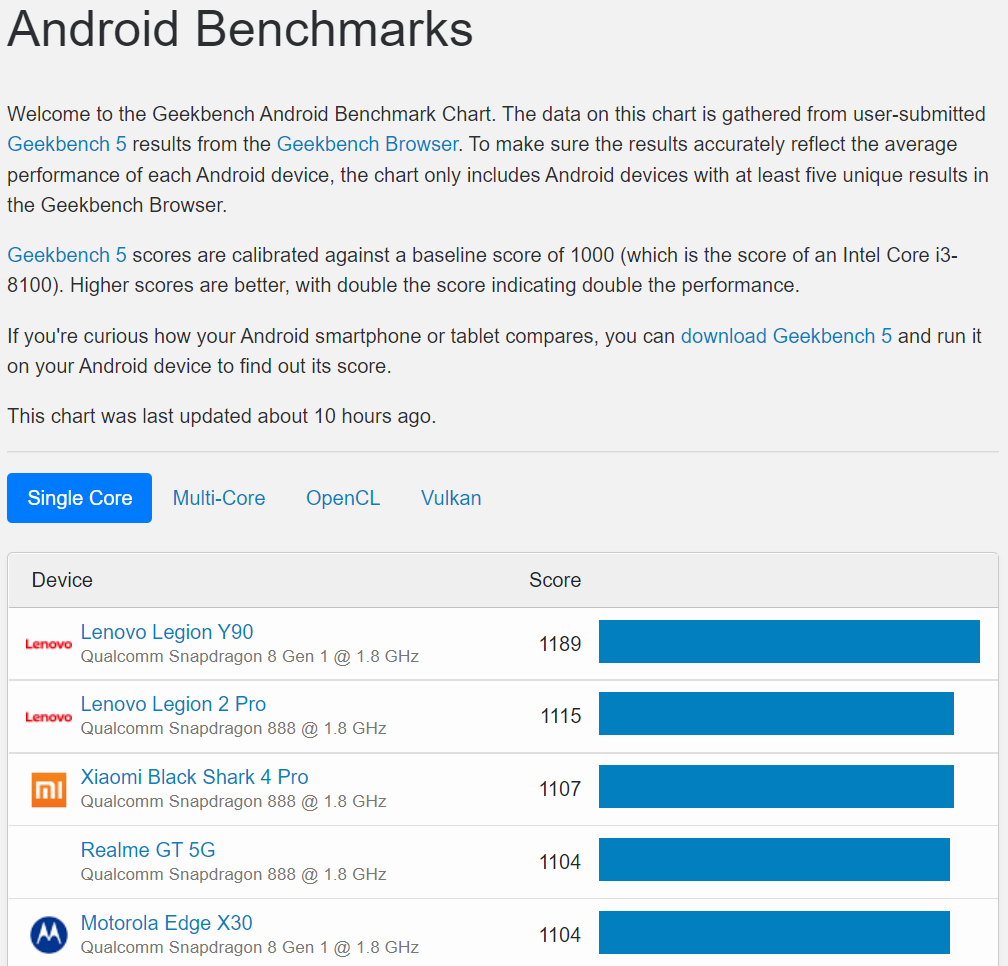
Geekbench Html 的結構如下:
1 | |
所以順序是
- Use BeautifulSoup to find <head> tag and exatract the title
- Use BeautifulSoup to find
tag and exatract the title - Use BeautifulSoup to find <tbody> tag and exatract the Single-Core device and score
- Use BeautifulSoup to find <tbody> tag and exatract the Multi-Core device and score
- Use BeautifulSoup to find <tbody> tag and exatract the OpenCL device and score
- Use BeautifulSoup to find <tbody> tag and exatract the Vulkan device and score
1 | |
Step 4: 透過 Python 將資料存入 SQLite
參考:[@fishPythonSQLite2018]
很多時候我們會有資料儲存的需求,但又不想花過多的時間在安裝資料庫及種種繁瑣的設定,此時就可以考慮使用 SQLite. Python 內置 SQLite 非常方便。 SQLite 是一種 RDBMS (Relational DataBase Management System). 使用 SQL (Structured Query Language) 作爲溝通的 interface.
RDBMS 的結構 db $\to$ tables $\to$ fields $\to$ records
1. 使用 DB Browser for SQLite 建立 database

Database: benchmark.db
2. 建立 table
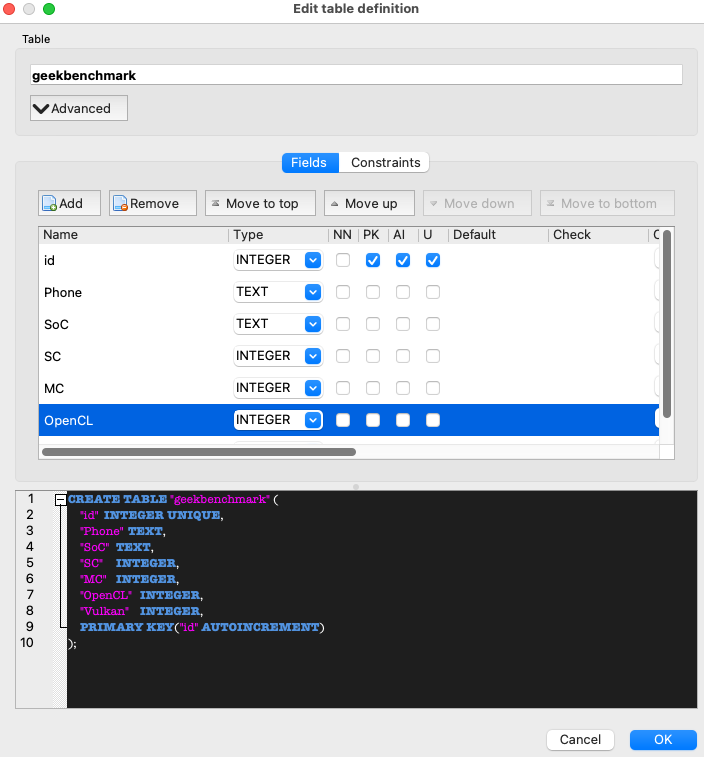
RDBMS 是由一張或多張 excel-like tables 組成。我們可以用 DB Browser create “geekbenchmark” table.
一個 table 包含多個 fields, 一般都會放 id 作爲第一個 field, 並設爲 PK (Primary Key)
Field Type and Attribute
基本 field type 有五種: INTEGER, TEXT, BLOB, REAL, NUMERIC
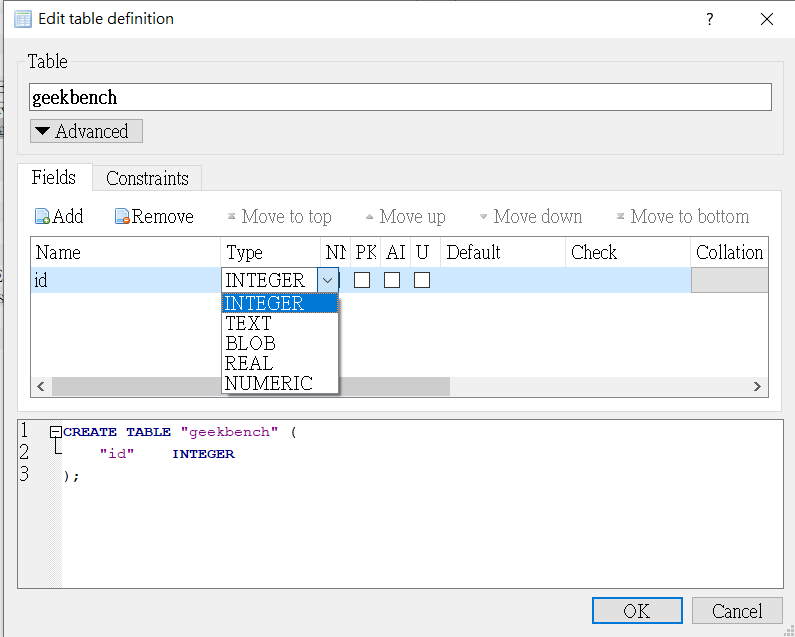
Real = Float?
How about Date?
Attribute: PK: Primary Key; AI: Auto Increment?; U ?
Field Name
Field Name: id, Phone, SoC, SC, MC, OpenCL, Vulkan
OK -> Write Change to save the database
3. 把爬下來的資料存在 SQLite database (Insert Record)
SQLite 和 MySQL database 的結構和語法基本一樣。好處是 python built-in support to access SQLite database. 第一步是建立 connection and cursor position.
1 | |
一但 connection 建立,接下來就可以直接執行 SQL record insert, update, query, 使用 .execute(“SQL syntax”).
如果要 pass variables, 記得使用 ? in query, 並且 (var1, var2, ), 最後的 “,” 非常重要 (I don’t know why!)
大概就是這樣,ready to go!
SQL 常用語法:
Insert record
1 | |
Update record
1 | |
Query and fetch
1 | |
Reference
Math Stat II - XYZ Entropy and XYZ Information
Introduction
Entropy (熵) 是物理中非常重要但又很難抓住的觀念。似乎只有巨觀或是統計的定義,缺乏微觀或是第一性原理。
常見的説法是亂度。熱力學定律亂度會隨時間增加,因此一個對時間方向(過去、現在、未來)的觀察就是用亂度增加來定義。微觀的物理定律基本都是對時間方向對稱,沒有對應 entropy 的觀念。Entropy 似乎存在巨觀或是統計的定義。
Shannon 在二十世紀給 information 一個石破天驚的定義,就是 entropy. 這個定義把物理的熱力學、統計力學和 information/communication/data science 連結在一起,非常了不起的發現和洞見。
**基本 entropy 和 information 可以互換。另外所有的 entropy (self/conditional/cross) 和 information (Shannon/Fisher/mutual) 都是正值 (Wrong! discrete RV 都是正值。Continuous RV 有可能負值,不過是少數例外的情況。) **
Q1: Maximum likelihood estimation (MLE) and maximum mutual information (estimation?) 是同樣的事?或是同等的觀念只是不同的 objectives?
Ans: **No. MLE 是針對 “parameter” estimation. Maximum mutual information (i.e. joint-entropy) 比較類似 maximum entropy principle 是針對 distribution 的 constraint 或者更精確是 “bound”. ** 例如:
-
Maximum entropy principle: given a fixed variance $\sigma^2$, Normal disribution $N(\mu, \sigma^2)$ 有最大的 entropy (bound)!. 注意 entropy or information 基本是 mean independent. 也就是無法做為 mean parameter estimation! (unlike MLE)
-
Noisy channel information theory: given a noisy channel (e.g. additive noise with noise $\sigma^2$ 或是 binary nose channel with probabiliy $p$ to make mistake). Maximum mutual information principle 提供 channel capacity, 就是如何 reliably communcate without error! 但並沒有說如何每一個 bit 如何 estimate 是 0 or 1。比較是一個 bound (constraint).
-
如果給一堆 (random) samples, MLE 是要從這堆 samples 估計出一個 given underline distribution 的 parameter (mean, variance, etc.). Maximum entropy or joint-entropy (or cross-entropy) 則是提供一個 “bound” to approach?
-
How about minimize cross-entropy loss? the same concept? 當我越接近這個 bound, 我越接近 true distribution? 或是抓到真正的 feature distribution? Yes!! 如同 self-entropy case, 如果越接近 maximum entropy bound, distribution 越接近 normal distribution? 比較間接方法得到一個 “distribution”, not a parameter!
-
舉例而言,一個 noisy communication channel, MLE 是每一個 bit 如何估計是 0 or 1. Maximum mutual information principle 提供 channel capacity, 就是如何 reliably communcate without error! 但並沒有說如何每一個 bit 如何 estimate 是 0 or 1。比較是一個 bound (constraint).
-
當然 MLE 在 Bayesian 也變成 distribution estimation instead of parameter estimation. (Max) Information or (Min) cross-entropy 也可以用來 constraint/bound the distribution, 兩者也變的相關或相輔相成。(self, mutual, conditional?) information 應該無法 estimation mean; 但是 cross-entropy 則和 mean 相關,好像可以用來 estimate mean? Relative entropy = self-entropy + KL divergence (cross-entropy?)
Q2: The difference between (statistics) communication estimation theory and machine learning theory.
Q2b: how the PCA vs. mutual information at feature selection?
Ans:
Q3: Relative entropy is the same as KL divergence (sort of geometric meaning of distance between two distribution). What is cross entropy physical or geometric meaning?
Ans:
Shannon Information : (Self)-Entropy
分成 continuous variable or discrete random variable.
Discrete Random Variable
Self-entropy 的定義如下 \(\mathrm{H}(X)=-\sum_{i=1}^{n} \mathrm{P}\left(x_{i}\right) \log \mathrm{P}\left(x_{i}\right)\) 幾個重點:
- 因為 $\sum_{i=1}^{n} \mathrm{P}\left(x_{i}\right) = 1$ and $1\ge \mathrm{P}(x_{i})\ge 0$, 所以 discrete RV 的 entropy $H(X) \ge 0$. (注意,continuous RV 的 entropy 可能會小於 0!)
- Log 可以是 $\log_2 \to H(x)$ 單位是 bits; 或是 $\log_e \to H(x)$ 單位是 nat; 或是 $\log_{10} \to H(x)$ 單位是 dits.
Continuous Random Variable
Self-entropy 的定義如下 \(\mathrm{H}(X)=-\int p\left(x\right) \log p\left(x\right) d x\) 幾個重點:
- 因為 $\int p\left(x\right) d x = 1$. 重點是 $p(x) \ge 0$ , 但 $p(x)$ 可以大於 1. 所以注意,continuous RV 的 entropy 可能會小於 0!
- Log 可以是 $\log_2 \to H(x)$ 單位是 bits; 或是 $\log_e \to H(x)$ 單位是 nat; 或是 $\log_{10} \to H(x)$ 單位是 dits.
Example 1: Entropy of a uniform distribution, X ∼ U(a, b)

$H(X) = \log (b-a)$
Note that $H(X) < 0$ if $(b-a) < 1$
Example 2: Entropy of a normal distribution, $X \sim N(\mu, \sigma^2)$
\[H(X) = \frac{1}{2}\ln (2\pi e \sigma^2) = \frac{1}{2}\ln (2\pi \sigma^2) + \frac{1}{2} \label{entNormal}\]Note that $H(X) < 0$ if $2\pi e \sigma^2 < 1$, entropy 和 mean 無關,只和 variance 相關。

Maximum Entropy Theory
這是一個常用的理論:Given a fixed variance, maximum entropy distribution 是 normal distribution (independent of mean).
因此 normal distribution 的 entropy 也就是 entrropy 的 upper bound!!, 如上圖。
Self-Entropy Summary
Entropy 是衡量一個 distribution 的亂度或資訊量 (通常大於 0): Distribution $\to$ Scaler (>0). Maximum entropy theory 則是 given 一個 scaler ($\sigma^2$), 找出最大 entropy 的 (normal distribution), 其實就是 Scaler (>0) $\to$ Distribution
Entropy/information 基本和 distribution 的 mean 無關。 如果是 normal distribution, $\eqref{entNormal}$ 告訴我們 entropy/information 和 variance 是一對一的關係。從 entropy 可以完全決定 distribution (除了 mean 之外)。
初步直覺,maximum entropy 也許可以用來 estimate variance 之類的 parameter, 但無法 estmate mean. 因此 in general maximum entropy 和 maximum likelihood estimation 是不同的東西。
XYZ-Entropy
一個隨機變數 (RV) 的 distribution 沒有太多的變化。接下來我們考慮兩個隨機變數相關的 entropy/information.
我們先看幾個例子
Noisy Channel (Estimation)
| 在 communication 或是 storage 常常見到這類問題。Source (Z) 是 hidden state, 一般是 binary 0 or 1. Channel 可以是 additive noise channel 或是 binary noisy channel. Output (X) 是 observation (evidence),可以是 continuous 或是 binary. 數學上一般用 $p(x | z)$ 表示。 |

一般 (X, Z) 有 correlation, 或者是 mutual information. 這是一類問題,計算 channel capacity,就是這個 channel 能送多少 information reliably. Mutual information 是一個 global 概念,不是用個別 X or Z sample 的問題。
另一類問題是從個別 X estimate 個別 Z. 這是 estimation problem.
- Maximum Likelihood Estimation (MLE), why not MAP? MAP is biased (by the prior distribution)!
In turn of information theory => find the maximum mutual information between (X, Z): overall channel capacity, not individual X.
Is Maximum Log-Likelihood Estimation this same as Maximum Mutual Information??? : NO
In machine learning such as VAE. 問題不同!
Macine Learning VAE 的 goal: (1) Maximize the mutual information of (X input, Y output) ! (2) Maximize the hidden variable (z, at the middle) 的 self-information! (regularization)
Why? 如果 ML 只是 maximize mutual information of (X, Y) => 就讓 Y = X 就 OK! 顯然不是我們要的,因爲在 training 才有 X; 在 inference (or generation) 沒有 X, 需要從 Z (hidden variable) 產生 Y!
所以目標變成 maximize the mutual information of (X, Y) and mzximize the self-entropy of hidden variable Z (Gaussian) during training. 這樣在 inference 時才能保證 (z, X_bar) has the maximum mutual information?
Is PCA a maximum mutual information?

Relative entropy and cross entropy 非常類似!
-
測量兩個 (marginal) distributions 的相似程度,沒有任何測量兩個 distribution 的相關程度!也許這樣就夠了? for machine learning or deep learning with very high dimension? NO! See VAE 的推導,仍然等價與 VAE loss = -1 x mutual information + KL divergence of regularion term (KL(p(z)//q(z x)) -
一般是數學工具用於理論推導 (VAE) or formulation (cross entropy loss)
-
Statistics Communication 比較簡單,能夠控制的不多。目標就是 maximize mutual information of (X, Y)
- ML 可以通過使用 neural network 引入 regularization term? 除了 maximize mutual information (X, Y) 還要 balance regularization to make the hidden variable 是非常 simple (high entropy) distribution?
ML 的 goal: (1) Maximize the mutual information of (X input, Y output) ! (2) Maximize the hidden variable (z, at the middle) 的 self-information! (regularization)
Why? 如果 ML 只是 maximize mutual information of (X, Y) => 就讓 Y = X 就 OK! 顯然不是我們要的,因爲在 training 才有 X; 在 inference (or generation) 沒有 X, 需要從 Z (hidden variable) 產生 Y!
所以目標變成 maximize the mutual information of (X, Y) and mzximize the self-entropy of hidden variable Z (Gaussian)
=

Relative Entropy (~KL Divergence)
我們先從最簡單的 relative entropy (相對熵) 開始,等價於 KL (Kullback-Leibler) divergence, 其定義:


幾個重點:
-
KL divergence 永遠大於等於 0 (regardless discrete or continuous distribution)! 如果兩個 distribution 長得完全一樣,KL divergence = 0. 因此有時用來衡量兩個 distribution 的 “距離”。兩個問題:(1) KL divergence 不對稱 KL(P Q) <> KL(Q P) 和一般距離的概念不同;(2) KL divergence 完全沒有考慮兩個 distribution 的”相關性”。 -
KL divergence 只是測量兩個 (marginal) distributions 的相似程度,沒有任何測量兩個 distribution 的相關程度! 例如 P ~ N(0, 1), Q ~ N(0, 1) DKL(P Q) = 0 不論 P, Q 是完全 independent, 或是完全相關。因爲 KL divergence 不含 P, Q joint pdf 或是 P, Q conditional pdf. -
KL divergence 一般是數學工具用於理論推導。但是 P 或是 Q 可以是 conditional pdf, 如此 KL divergence (relative entropy) 可以衡量兩個distribution 的相關性! ( I(X; Y) = E{KL(P(X Y) P(X) ))}) -
Cross entropy = H(p) + KL(P Q)
Cross Entropy (Loss)
在資訊理論中,基於相同事件測度的兩個概率分布{\displaystyle p}


the other equation we need (using this new nn-normalized formulation) is the formula for cross-entropy. It is almost identical, but it compares two different probabilities: it gives us a way to measure the “cost” of representing one probability distribution with another. (Concretely, suppose you compress data from one distribution with an encoding optimized for another distribution; this tells you how many bits it will take on average.)


同樣 cross entropy 沒有考慮兩個 distribution 的相關性。只是 distribution 的形狀。
-
Cross entropy 也是不對稱。如果 q distribution 和 p distribution 完全一樣,則是 H(p, q) = H(p), 如果不一樣, H(p, q) > H(p) or H(p, q) - H(p) = KL(p q). 一般 machine learning 好像就是 minimize cross entropy loss. NO! still involve mutual information + regularization. - Minimize cross-entropy loss in a sense to minimize KL divergence of (p, q)? 爲什麽不直接 minimize relative entropy? 有 regularization 的意味嗎 ?
Conditional entropy, joint entropy (mutual information) 則是另一組。重點不是 distribution 的形狀,而是兩個 RV 的相關性!!! 主要用於 communication theory. recovery signal from noise.
Q: diffusion model for generative model?
Conditional Entropy, Joint Entropy (Mutual Information), Marginal Entropy,
In probability theory and information theory, the mutual information (MI) of two random variables is a measure of the mutual dependence between the two variables. More specifically, it quantifies the “amount of information” obtained about one random variable, through the other random variable.
Not limited to real-valued random variables like the correlation coefficient, Mutual Information is more general and determines how similar the joint distribution p(X,Y) is to the products of factored marginal distribution p(X)p(Y). Mutual Information is the expected value of the pointwise mutual information (PMI).


| H(X) = H(X | Y) + I(X; Y) |
| H(Y) = H(Y | X) + I(X; Y) |
| H(X, Y) = H(X) + H(Y | X) = H(Y) + H(X | Y) = H(X) + H(Y) - I(X; Y) |
I(X; Y) = H(X) + H(Y) - H(X, Y)
I(X;Y) ≤ H(X) and I(X;Y) ≤ H(Y)
可以證明: H(X), H(Y), H(X, Y), I(X; Y) ≽ 0
| 如果 X and Y 獨立。 I(X; Y) = 0, H(X | Y) = H(X), H(Y | X) = H(Y), H(X, Y) = H(X)+H(Y) |
如果 Y 完全 depends on X. I(X; Y) = H(X) = H(Y) = H(X, Y)

Cross Entropy
Cross Entropy & DL-divergence
Cross Entropy & Fisher Information
Fisher information
Fisher information and cross-entropy
VAE Loss Function Using Mutual Information
VAE distribution loss function 對於 input distribution $\tilde{p}(x)$ 積分。 $\tilde{p}(x)$ 大多不是 normal distribution.
\[\begin{align*} \mathcal{L}&=\mathbb{E}_{x \sim \tilde{p}(x)}\left[\mathbb{E}_{z \sim q_{\phi}(z | x)}[-\log p_{\theta}(x | z)]+D_{K L}(q_{\phi}(z | x) \| \,p(z))\right] \\ &=\mathbb{E}_{x \sim \tilde{p}(x)} \mathbb{E}_{z \sim q_{\phi}(z | x)}[-\log p_{\theta}(x | z)]+ \mathbb{E}_{x \sim \tilde{p}(x)} D_{K L}(q_{\phi}(z | x) \| \,p(z)) \\ &= - \iint \tilde{p}(x) q_{\phi}(z | x) [\log p_{\theta}(x | z)] dz dx + \mathbb{E}_{x \sim \tilde{p}(x)} D_{K L}(q_{\phi}(z | x) \| \,p(z)) \\ &= - \iint q_{\phi}(z, x) \log \frac{ p_{\theta}(x, z)}{p(x) p(z)} dz dx + \mathbb{E}_{x \sim \tilde{p}(x)} D_{K L}(q_{\phi}(z | x) \| \,p(z)) \\ \end{align*}\]對 $x$ distribution 積分的完整 loss function, 第一項就不只是 reconstruction loss, 而有更深刻的物理意義。
記得 VAE 的目標是讓 $q_\phi(z\mid x)$ 可以 approximate posterior $p_\theta(z\mid x)$, and $p(x)$ 可以 approximate $\tilde{p}(x)$, i.e. $\tilde{p}(x) q_{\phi}(z\mid x) \sim p_\theta(z\mid x) p(x) \to q_{\phi}(z, x) \sim p_\theta(z, x)$.
此時再來 review VAE loss function, 上式第一項可以近似為 $(x, z)$ or $(x’, z)$ 的 mutual information! 第二項是 (average) regularization term, always positive (>0), 避免 approximate posterior 變成 deterministic.
Optimization target: maximize mutual information and minimize regularization loss, 這是 trade-off.
\[\begin{align*} \mathcal{L}& \sim - I(z, x) + \mathbb{E}_{x \sim \tilde{p}(x)} D_{K L}(q_{\phi}(z | x) \| \,p(z)) \\ \end{align*}\]Q: 實務上 $z$ 只會有部分的 $x$ information, i.e. $I(x, z) < H(x) \text{ or } H(z)$. $z$ 產生的 $x’$ 也只有部分部分的 $x$ information. $x’$ 真的有可能復刻 $x$ 嗎?
A: 復刻的目標一般是 $x$ and $x’$ distribution 儘量接近,也就是 KL divergence 越小越好。這和 mutual information 是兩件事。例如兩個 independent $N(0, 1)$ normal distributions 的 KL divergence 為 0,但是 mutual information, $I$, 為 0. Maximum mutual information 是 1-1 對應,這不是 VAE 的目的。 VAE 一般是要求 marginal likelihood distribution 或是 posterior distribution 能夠被儘可能近似,而不是 1-1 對應。例如 $x$ 是一張狗的照片,產生 $\mu$ and $\log \sigma$ for $z$, 但是 random sample $z$ 產生的 $x’$ 並不會是狗的照片。
這帶出 machine learning 兩個常見的對抗機制:
- GAN: 完全分離的 discriminator and generator 的對抗。
- VAE: encoder/decoder type,注意不是 encoder 和 decoder 的對抗,而是 probabilistic 和 deterministic 的對抗 => maximize mutual information I(z,x) + minimize KL divergence of posterior $p(z\mid x)$ vs. prior $p(z)$ (usually a normal distribution).
(1) 如果 x and z 有一對一 deterministic relationship, I(z, x) = H(z) = H(x) 有最大值。但這會讓 $q_{\phi}(z\mid x)$ 變成 $\delta$ function, 造成 KL divergence 變大。 (2) 如果 x and z 完全 independent, 第二項有最小值,但是 mutual information 最小。最佳值是 trade-off result.
Reference
[1] Wiki, “Cross entropy”
[2] James Gleich, “The Information: A History, a Theory, a Flood”
[3] “Lecture 11 : Maximum Entropy”
[4] Wiki, “Maximum entropy probability distribution”
熵 = uncertainty = information (in bit)
Two PDFs in Communication
熵用在編碼和通訊請參見前文。對一個通訊系統包含兩個 probability distributions.
一個是 source probability distribution, 一個是 channel noise 形成的 channel probability distribution.
分別對應 H (source entropy) 和 C (channel capacity).
為了讓 source information 能夠有效而且無損的傳播,需要使用 source/channel encoder/decoder.

Go Fundamental
另一個更基本的觀點,輸入 (source) 是一個 probability distribution X, 通過 channel probability distribution Q,
得到輸出 probability distribution Y.

基本的問題是 X and Y 能告訴什麼關於 information 的資訊?
X and Y 的 probability 可以定義:
p(x): source probability
| p(y | x): conditional pdf, 其實就是 channel probability distribution Q |
| p(x, y) = p(x) p(y | x) |
p(y) = ∑x p(x, y)
對應的 entropy (or information) related:
H(x) = Ex(-log p(x)): source entropy or source information in bit
| H(y | x) = Ey | x(-log p(y | x)) : channel entropy 如果是 symmetric channel, 就和特定的 x 無關! |
| H(x, y) = Ex,y(-log p(x, y)) = Ex,y(-log p(x)) + Ex,y(-log p(y | x)) = H(x) + H(y | x) assuming symmetric channel! |
H(y) = Ey (-log p(y)) ≽ H(x) in cascaded structure (entropy always increase?!)
| 直觀而言,Q (p(y | x)) 的 entropy 愈小 (capacity ~ 1), p(y) ~ p(x). |
H(y) ~ H(x) (information preserve).
如果 Q 是 50%/50% probability distribution (capacity ~ 0), H(y) ~ 1-bit.
Output Entropy 增加,information 無中生有?
顯然 information 只看 output probability distribution 是無意義的。因為 entropy 一定愈來愈大。
直觀上 entropy/information 不可能無中生有。必須另外找 X,Y information 的定義。
Wrong explanation!
Channel noise 也有 entropy/information. Output information 包含 source 和 noise information. Information 並未無中生有。
| 我們要找的是和 input source 有關的 information, 就是 H(Y) - H(Y | X), output information 扣掉 channel noise/information. |
剩下的是和 input source 直接相關的 information (i.e. mutual information), 顯然 mutual information 一定等於或小於 input information.
Two Entropies in Communication
下圖清楚描述 entropies 在 communication 的變化。 X -> Y ; H(Y) ≽ H(X)

| I(X; Y) = H(Y) - H(Y | X) 是存留的 H(X) information after channel contamination H(X | Y). |
| 顯然 I(X; Y) depends on H(X) and H(Y | X); I(X; Y) 可視為 information bottleneck or channel capacity. |
| H(Y | X) 是由 channel noise model 給定。所以 channel capacity 由 Px(x) 決定。 |
Channel capacity 的定義:

| C = sup I(X; Y) = sup [ H(Y) - H(X | Y) ] = sup [ H(Y) - Hb ] = 1 - Hb (proof) |
The channel capacity of the binary symmetric channel is
where {\displaystyle \operatorname {H} _{\text{b}}(p)}
Two PDFs in Encoding
Cross Entropy (交叉熵)
In information theory, the cross entropy between two probability distributions 

measures the average number of bits needed to identify an event drawn from the set, if a coding scheme is used that is optimized for an “unnatural” probability distribution 

幾個重點:
\1. p and q 都是 probability distribution 而且 over the same set of events (或是 same discrete classes for machine learning).
\2. 假設 p 是 true distribution, cross entropy H(p, q) 代表 q distribution 和 p 的距離?No, that is KL divergence.

-log q 顯然不是真的 information. -log q ≽ 0, 所以 H(p, q) = Ep(-log q) ≽ 0, H(p, q) ≠ H(q, p)
| H(p, q) = H(p) + D(p | q), where H(p) 是 true information, D(p | q) 是 KL divergence ≽ 0 |
| D(p | q) 就是冗余。 H(p, q) = H(p) (true information) + D(p | q) (冗余) |
H(p, q) ≽ H(p) 但是 H(q) 不一定大於 H(p). 因為 q distribution 可以任意選,說不定選的 q 的 H(q) 小於 H(p).
但是 H(p, q) 永遠大於等於 H(p), 多出的部分就是冗余。
For example, 英文有 26 字母。出現的統計特性不同,一般 ‘e’ and ’t’ 有非常高的頻率。’z’ 又很低的頻率。
假設 “true” distribution p 是 32-bit 的 Binomial distribution, H(p) = 3.55-bit
假設 q distribution 是 32-bit uniform distribution, H(q) = 5-bit
| H(p, q) = H(p) + D(p | q) = 3.55 + ?? = - sum { p(x) log 1/32 } = 5-bit |
| D(p | q) = 5 - 3.55 = 1.45 bit 就是冗余 |
if p = q, same distribution H(p, q) = H(p) = H(q)
if q is a uniform distribution, H(p, q) = - log q(x) = n for 2^n outcomes.
注意 if q 是 uniform distribution, H(p, q) = H(q) = n 是和 p (true distribution) 無關!
但若 q 不是 uniform distribution, H(p, q) ≠ H(q)
如果沒有 prior knowledge of true distribution p. 最直接的方法是選 q 為 uniform distribution.
H(p, q) = H(q) = n, H(p) 一定小於等於 H(p, q). 多出的部分是冗余,可以之後由 posterior data infer.
Relative Entropy (相對熵)
Relative entropy (相對熵) 是和 cross entropy (交叉熵) 非常相似而且容易混淆的名詞。
Relative entropy 就是 Kullback-Leibler divergence, 用來測量兩個 PDFs 的相似程度。

| 如果 P and Q PDFs 長的完全一樣。D(P | Q) = 0. 可以證明 D(P | Q) ≽ 0. |
| H(p, q) = H(p) + D(p | q) |
=> Cross entropy = “true” entropy + relative entropy or 交叉熵 = “真“ 熵 + 相對熵
Two PDFs in Summary
Two PDFs (p and q) 有兩種可能情況:
(1) over two different sets of events,或是說兩個 random variables, X, Y 各自的 distributions, p(x) and q(y).
由此可以定義 X, Y 的 mutual information,I(X;Y), 就是 X, Y information 交集(或相關)的部分。
I(X; Y) ≤ H(X) or H(Y)
如果 X 和 Y 有因果關係;例如通訊系統 X 是 transmitted signal, Y 是 received signal. 或是在 storage system,
X 是 stored signal, Y 是 read out signal. 可以定義 channel capacity C = sup I(X; Y) over all p(x).
| 一般而言 p(x) 是 uniform distribution (max H(X)) 而且 p(y | x) 是 symmetric, 會有 max I(X; Y). |
可以想像 I(X; Y) 成 p and q 是 topology 某種串聯。但 mutual information 卻變小。(不要想 resistance, 想 conductance).
(2) over same set of event, 就是同一個 random variable 卻有兩個 distributions. 顯然一個, p(x), 是 true distribution;
q(x) 是近似 distribution 或是 initial guessing distribution. 此時可以定義 cross entropy H(p, q) = H(p) + DL(p//q)
代表 approximate distribution 和 true distribution 的 information 的關係。注意是 true information (in bit) 加上冗余 information (in bit).
H(p, q) ≽ H(p) ,但 H(p, q) 或 H(p) 不一定大於或小於 H(q)
可以 H(p, q) 想像成 p and q 是 topology 某種並聯。但 cross entropy 卻變比 H(p) (but not necessary H(q)) 大。
乍看冗余是壞事,在 (2) 我們希望冗余愈小愈好,最好是零。這正是 source encoder 做的事 (source encoding or compression).
事實並非如此。參考[2], 冗余在 noisy channel, 也就是 (1) 的情形,有助於達到 error free communication. 這在日常口語很常見。
即使部分的聲音沒聽清楚,我們還是可以根據上下文判斷正確的意思。
重點是最少要加多少冗余,以及如何加冗余。這正是 channel encoder 做的事。
Shannon-Hartley 告訴我們 channel capacity 和 SNR and Bandwidth 的關係。但是並未告訴我們如何加冗余。
(間接)可以算出最少加入冗余 (error correction code),使通訊系統有機會達到 Shannon channel capacity without error.
Example:
H(source) = 1-bit C = 0.5-bit 根據 Shannon-Hartley theorem 是無法達到 error free communication.
如果 code rate 1/3 (e.g. LDPC)
H’(source) = 1-bit C’ = 1.5-bit 有機會達到 arbitrary low error rate.
下圖顯示 output signal y = x + noise 的 H(y) > H(x). 在 output 之後需要加上一個 decoder block.
Decoder 的目的是從 y 得到 x’, 而且 x’ = x. 用數學表示
H(x’) = H(x) < H(y) 同時 I(x’, x) = H(x)

從熱力學角度來看,decoder 是做減熵同時又要回到和 source 一樣的 mutual information. (reverse the process)
這是需要付出代價,就是“做功”。 Decoder 直觀上需要“做功”才能達到減熵的效果。
Decoder complexity 相當於“做功”。 Kolmogorov 的 algorithmic information theory 就是在處理這個部分。
即使在熱力學也有類似的問題:Maxwell demon 也是用 computation or algorithm 減熵。
當然 total system entropy (including the computation) always increase. 沒有違反熱力學第二定律。
Two PDFs in Machine Learning
機器學習或是深度學習是熱門題目。結合 learning 和 information theory 的相關 papers 車載斗量。
似乎不若 communication 或是 coding theory 有簡單而深刻的結論。有一些有用的技巧如下。
Cross Entropy or Relative Entropy Minimisation (Optimization)
Cross entropy or relative entropy can be used to define the loss function in machine learning optimization.
The true probability {\displaystyle p_{i}}

在分類問題 (classification) 大多的情況沒有 “true probability distribution”, 只有 (truth) label samples, {0, 1} or multiple classes with (one-shot) label.
Predicted probability 通常由 logistic function 或是 neural network 產生,目標是儘量接近 true probability distribution.
| 有兩個方法:(1) minimize relative entropy or KL divergence D(p | q); or (2) minimise cross entropy H(p, q) = H(p) + D(p | q). |
如果 p 是 “true probability distribution”, H(p) 可視為常數。(2) 和 (1) 基本等價。
常見的 binary classification 可以用 minimise “cross entropy loss” 達成。

| Cross entropy 和 relative entropy 完全相同因為 H(p=0) = H(p=1) = 0, H(p, q) = D(p | q) |
y^ 通常由 logistic function 計算得出:

Cross entropy loss function 定義 cross entropy 的 sample average.

如果 y=1: -[y log y^ + (1-y) log (1-y^)] 如下圖。如果 y=0: 下圖左右鏡射。 J(w) 就是很多這樣的 loss function 平均的結果。
J(w) ≽ 0

Given y^ = 0.9
if y = 1
BCE loss = -1 * [ 1 * log 0.9 + 0 * log 0.1 ] = - log 0.9 = +0.15 (in bit)
if y = 0
BCE loss = -1 * [ 0 * log 0.9 + 1 * log 0.1 ] = - log 0.1 = +3.32 (in bit)
Question:
y^ 是否有可能收斂到 0 and 1? 或是 J(w) 收斂到 0? Yes, if samples are separable in binary classification.
想像 1D logistic regression, 如果 samples 是 binary separable, w (weight factor) 可以是無窮大,g(z) 就會是 0 or 1.
| 如果 y^ = g(z) 正確 training 到 y (0 or 1), H(y, y^)=D(y | y^)=H(y)=J(w)=0 (no information in samples since it’s already labelled) |
實務上會加上 regularisation term L2 norm of x 避免 overfitting. 因此 y^ 不會收斂到 0 and 1. J(w) always larger than 0.
One-hot category (more than binary class) classification 也可以用 minimise “cross entropy loss” 達成。
同樣 cross entropy:

y,’ 是 true label {0, 1} in K class. Cross entropy 完全相等於 relative entropy (KL divergence) 只要是 one-hot.
yi 是 softmax function (logistic function 的推廣)計算得出。

單一 sample cross entropy: -[ 0* log(0.3) + 0* log(0.25) + 1*log(0.45)]
Cross entropy loss function 同樣是 cross entropy 的 sample average.
Maximal Entropy Principle (Convex Optimization)
熱力學告訴我們宇宙 (或 close system) 的熵總是增加。
如果不知道 probability distribution, 就用 maximum entropy principle [4] 求得 probability distribution.
一般情況會有 constraints/prior information.
例如英文字母的機率分佈的 constraint 是 bounded 26 個字母。
Maximum entropy distribution for bounded constraints (discrete or continuous) is uniform distribution [4].
Maximum entropy distribution for fixed mean and variance is normal distribution [4].
Maximum entropy distribution for a fixed average kinetic energy (fixed T, temperature) is Maxwell-Boltzmann distribution.
Maximal entropy optimization 有一個很大的優點:entropy function 是 concave function. 可以用 convex optimization.
Entropy in Machine Learning
Maximal entropy optimization
Probability —> information by Shannon
How about Algorithm? (coding theory) —> information? by Komologov?
coding theory —> complexity theory —> information??
Analogy between thermodynamics and information theory
AI for AI (I) - Github Copilot
Introduction
AI for AI: use github Copilot for general signal processing, plotting, and machine learning.
Python Copilot
結論:Copilot 對一般的 python programming 初步看起來不錯。對於 machine learning 部分還要再測試。
Get Max and Min of a list
非常容易,參考 reference
A Simple Calculator
非常容易,參考 reference
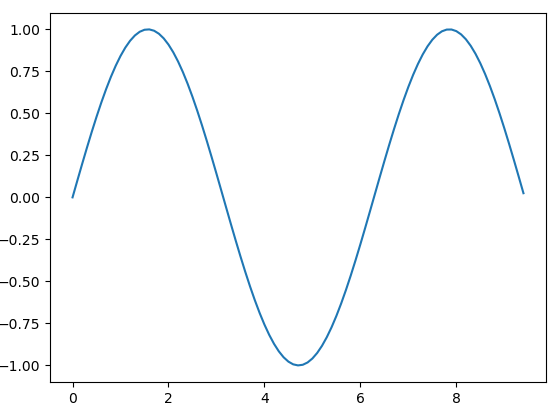
Plot a sine wave
只要 type ‘'’plot a sine wave using matplotlib’’’, 就會 generate the following code and work!!!
1 | |
Compute a FFT of a sine wave and plot
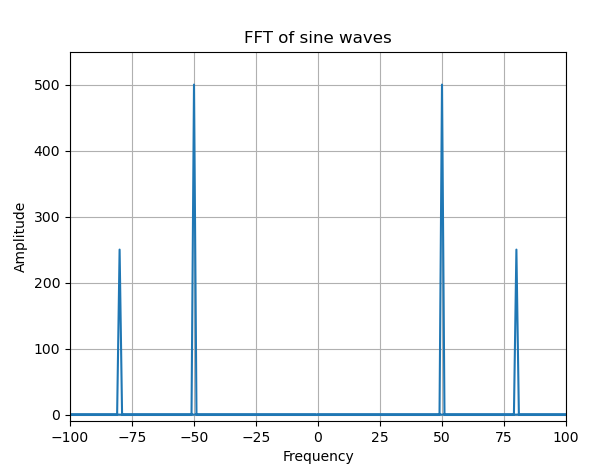
Type ‘'’compute fft of a signal and plot it’’’, 就會得到以下的 FFT 以及 plot in linear or log scale!
1 | |
Classification (MNIST)
是否可以用 copilot for image classification? Yes, need more exploration.
Use Pytorch as example
use [ctl-enter] to view all examples!
Start with comment: ‘’’ mnist example using pytorch’
First import all packages:
1 | |
再來是煉丹五部曲!
Step 1: load dataset, type: def load_dataset => return mnist train_loader, test_loader!
1 | |
Step 2: build a model: type : class resnet
1 | |
Step 3: train a network: type def train
1 | |
Step 4: test a trained network: type def test
1 | |
Julia Copilot
用幾個常見的例子。
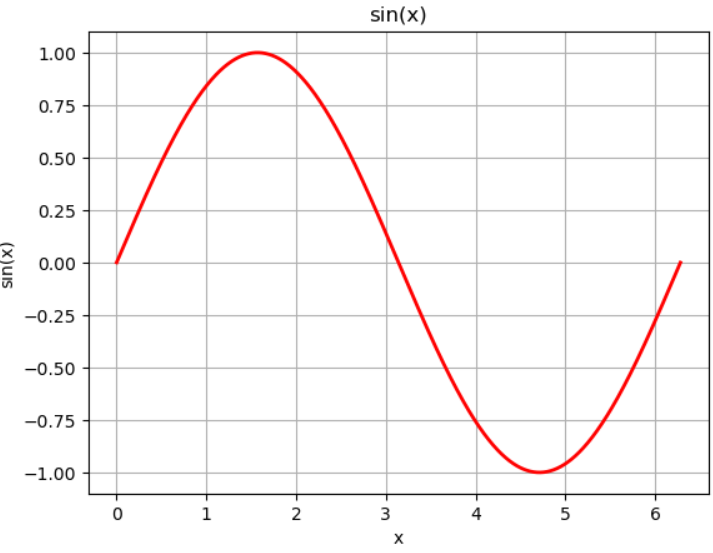
Plot a sin wave
Type “plot a sine wave”
1 | |
Results: failed.
Problem and fix.
- Still use old Julia code not working: linspace(0, 2pi, 1000) -> range(0, 2pi; length=1000)
- No vector operation: y = sin(x) -> y = sin.(x)
- Figure not display! Add display(gcf())
修改的版本 and work.
1 | |
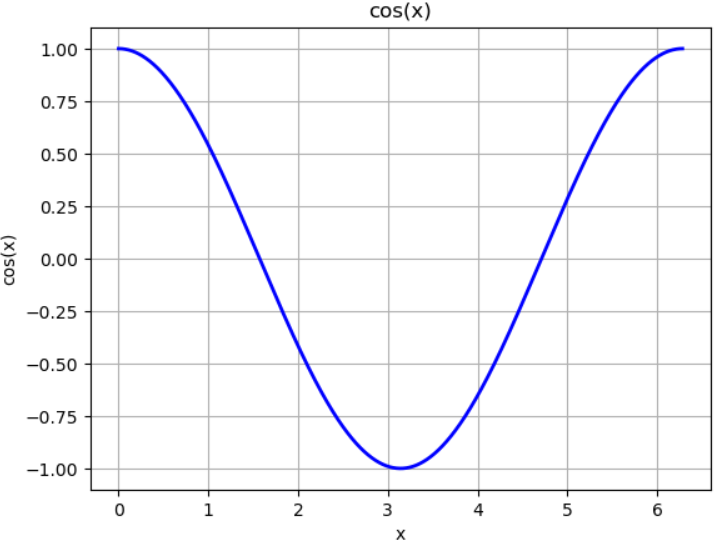
不過我再 type: plot a cosine wave, Copilot 可以現學現賣!
1 | |
Compute and Plot FFT
再 type “compute the FFT of a signal and plto the result”. 還是不行!
1 | |
-
Problem and fix.
- linspace(0, 2pi, 1000) -> range(0, 2pi; length=1000)
- No vector operation: sin(x) -> sin.(x); abs(x) -> abs.(x)
- plot -> PyPlot.plot
- Figure not display! Add display(gcf())
修改的版本 and work.
1 | |
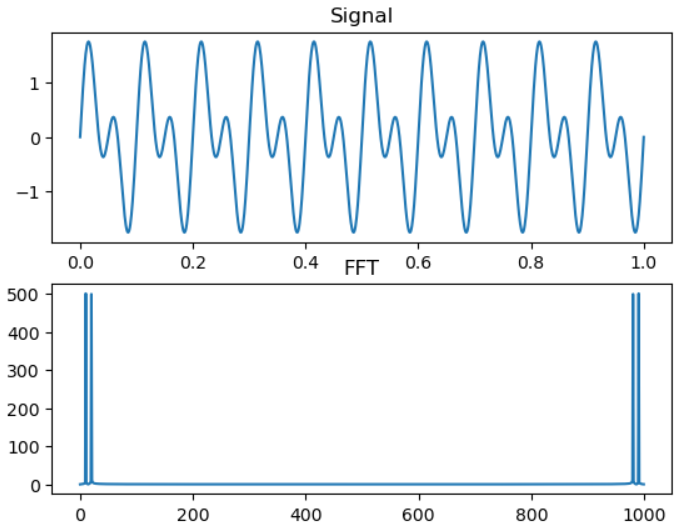
Compute and Plot Self Entropy
基本上 input title 和 input signal range. Copilot 自動 show 出 entropy 的 formula in vector form!
1 | |

Reference
Sufficient_stat
Next
Q: Score function 的幾何或是物理意義是什麽? D-log-likelihood function.
Q: 爲什麽 Fisher information = var = -1 * 2nd order derivative?
Q: 到底 variance 大比較好 estimate? (yes), 似乎 counter intuitive!! Variance 小比較好 estimate?
Fisher Information vs. Shannon Information
簡單的想法就是做 n 次實驗看 (joint) distribution. 不過又會牽扯 n 要選多少。在理論推導是最好只使用原始的 distribution (n=1).
Fisher 引入 score function (1st derivative of log-likelihood function)
我們定義
假設 $\sigma$ 已知,score function 是 1 dimension linear function with negative slope as below: \(s(\mu;x_1, \ldots, x_n) = l'\left(\mu, \sigma^2 ; x_1, \ldots, x_n\right)=\frac{1}{\sigma^2} \sum_{j=1}^n\left(x_j-\mu\right)\)
Parameter estimation 的考量:
先用 observed 的 (X1, X2, X3, …, Xn) 用一個公式,估計出 θest (e.g. θest = A/n, or any other θest = g(X1, X2, .., Xn) )
再來用 θest 同時做無窮個平行的想像實驗的 parameter,找出對應的 θest’ “distribution” based on the above 公式。
(1) 如何估計 θ: θest ? 用估計的 θest 做無窮平行想像實驗所估計的 θest’ 平均後應該要等於 (unbiased) 或趨近 θest, 就是 constentency. (ref: Wifi statistics consistency or Fisher consistency)
(2) 這個估計的 θest 有多準確? 或是 θest 的 variance (or 信心區間) 有多大? 用 Fisher 的話來說,是否 efficient.
(3) 這個 estimation θest 是否是 optimal? 如何定義 optimal? 可以從 (1) and (2) 來看,optimal 就是必須 consistency 而且最 efficient (最小 variance).
這 3 個觀念是環環相扣。如果 consistency 不成立。只要讓 θest = 0. 就會有最小的 variance. 也是最 optimla estimation. 但這是無用的 estimator.
因此 parameter estimation 最基本的觀念是 consistency. 就是用 estimated parameter 來作實驗,應該要得到一致性的結果。再加上有最好的 efficiency, 就是 optimal estimator.
想像如果我們估計的 θest 比真實的 θo 小 (e.g. θest = A/2n instead of A/n = θo/2)。雖然機率小,還是有機會丟出 A 次 head.
如果用這個 θest 同時做無窮個平行的 Bernoulli process with size n. 出現 head 次數的 distribution 就是 Bi-nomial distribution. 這個無窮平行想像實驗的 head 平均次數是 n*θest = A/2 次。從這些想像實驗估出的 θest’ = (A/2)/2n = A/4n!
明顯 θest <> θest’ 也就是不 consistent!
Fisher 1922 論証 (under some assumption) maximum likelihood estimator (MLE) 具有 consistency, sufficiency 的 optimal parameter estimator. (Fisher 認為 MLE 得出的 statistics are always sufficient statistics. 這個說法是有問題。請參考下一節的結論 “sufficiency …”)
Rao (1963) 証明了 MLE estimator is efficient (minimum variance) in the class of consistent and uniformly asymptotically normal (CUAN) estimator.
幾個常有的誤區:
* MLE 並非唯一的 consistent estimator. MLE 也並非 unbiased estimator. 無法從 (1) 推導出 MLE. 但可以証明 MLE 是 optimal estimator.
* Fisher 定義的 efficiency 是基於 minimum variance, 也就是 least mean square error/loss. 這並非唯一的 loss function.
例如也可以用 L1-norm loss function. 不同的 loss function 對應不同的 optimal efficient parameter estimator.
如何証明 MLE 是 consist and optimal parameter estimator?
Consistency 請參考 reference.
Optimality 就不是那麼容易。
Fisher 天才之處在1922 引入了 sufficient statistic 的觀念。1925 又引入了 Score and Efficiency 觀念
先說結論: (請參考 Stigler 的 The Epic Story of MLE)
Sufficiency implies optimality (efficiency, or minimum variance), at least when combined with consistency and asymptotic normality.
Fisher 給了一個簡潔有力的論証關於以上的結論。請參考 Stigler article.
In general 我們需要完整的 samples (X1, X2, …, Xn) 才能用於 parameter θ estimation.
Fisher 考慮是否能 “精練” 出 S(X1, X2, …, Xn) 針對 θ parameter, 就可以丟掉原來的 X1, X2, …, Xn 而不失去任何的統計資訊。切記這個 S(X1, X2, ..Xn), 稱為 sufficient statistic 必須是針對特定 θ (θ 可以是 vector, 包含多個參數); 而不是 sufficient statistic 可以任意取代原始的 samples 或 distribution. 如果真的如此,也不用 big data。只要存壓縮版的 sufficient statistic 就夠了。但我們永遠不知道日後會用原始資料來 estimate 什麼東西。
Fisher 的論証如下:
Maximum likelihood estimation –> Function of sufficient statistic –> Optimality

其中第一步是有問題的。Maximum likelihood estimation 並不 always 得出 sufficient statistic.
Fisher 當初計算幾個常用的 distribution 而得出 sufficient statistic 存在並且可由 MLE 推出。
實際上很多 distribution with parameter 並不存在 sufficient statistics. 但 MLE 存在且為 optimal!
之後 Fisher 也不再提出這個論証,而用其他的方法得到 MLE –> Optimality 的結論。
Sufficient Statistic
雖然 Fisher 後來沒有再用 sufficient statistics 証明 MLE 的 optimality.
Sufficient statistics 仍然是有用的觀念。常見於一些理論的 framework. (e.g. exponential family).
數學定義很直接如下。重點是可以推出 Fisher-Neyman factorization theorem.
例子和証明可以參考 wiki.


Exponential Family
再來看 Exponential Family, 基本上就是 sufficient statistic 的最佳代言。
Exponential Family 包含大多常見的 PDF/PMF 如下:
the normal, exponential,gamma, chi-squared, beta, Dirichlet, Bernoulli, categorical, Poisson, Wishart, Inverse Wishart and many others. A number of common distributions are exponential families only when certain parameters are considered fixed and known, e.g. binomial (with fixed number of trials), multinomial (with fixed number of trials), and negative binomial (with fixed number of failures). Examples of common distributions that are not exponential families are Student’s *t*, most mixture distributions, and even the family of uniform distributionswith unknown bounds.
Scalar parameter exponential family 可以表示如下:
where T(x), h(x), η(θ), and A(θ) are known functions.
* T(x) 就是 sufficient statistic.
* η 稱為 natural parameter.
* A(η) 稱為 log-partition function.
Exponential families 有一些重要的特性:
* Exponential families 的 sufficient statistics T(x) 可以 summarize arbitrary amount of IID data.
* Exponential families 都有 conjugate priors, 這對 Bayesian statistics 很有用。
* Exponential families 的 posterior pdf (prior * conditional pdf) 雖然有 close-form. 但大多非 exponential families. E.g. Student t-distribution.
Example of Normal distribution with known variance, estimate mean
This is a single-parameter exponential family, as can be seen by setting
Example of Normal distribution, estimate mean and variance
This is an exponential family which can be written in canonical form by defining
可以看到不同的 θ 對應不同的 sufficient statistics. 即使 PDF 的形式一樣。
f(x; Θ) 可以視為 PDF/PMF function of x given Θ. 或是 L(θ; X) likelihood function of θ given X.
Fisher 厲害之處在 explore f(x;Θ) or L(θ;X) 更多的統計特性
首先定義 score V (given observed X) as the gradient w.r.t. θ of the log likelihood function
V ≣ V(θ; X) = ∂ LL(θ; X) / ∂θ = ∂ log L(θ; X) / ∂θ = ∑ ∂ log L(θ, Xi)/∂θ
一般而言, L(θ) 不一定是 concave, e.g. normal distribution. 但 LL(θ) or log L(θ) or ∑ log L(θ) 通常是 concave.
顯然這是 MLE 的延伸。MLE 基本上是設定 gradient wrt θ 為 0. i.e. V = 0 得到最佳的 θmle given oberved X.
再來就是對 LL(θ; X) or V(θ; X) 在 θ=θest 作 Taylor series,
LL(θ; X) = C - n A/2 ( θ - θmle )^2 (Log Likelihood function 可以用 parabola 近似, 頂點就是 θmle)
V(θ; X) = ∂ LL(θ; X) / ∂θ = - n A ( θ - θmle ) (V 就是 Log Likelihood 的 gradient or 斜率)
E( V(θ; X) ) = 0
I(θ) = Var(V(θ; X)) = E( V(θ; X)^2 ) = - E( ∂V/∂θ ) = - E( ∂^2 log f(x; θ)/∂θ∂θ )
以上有點複雜, 有些參數有 n, 有些參數是 X or X。可以參考本文整理很清楚。
以下是 Score and Information 的解釋和推導
θ or θo 是 K dimension parameters. 一般 θ 是變數,θo 是 given a value.


l(θ; Z) = log L(θ; Z) 稱為 log likelihood function


Score 分為 score and sample score (n observed samples). 原則上都是 function of θ with a given Z or Zi.
但 Score s(θ; Z) 的 Z 可視為 random variable. 因此 E[ s(θ;Z) ] 是有意義。當然 Z 也可以是 observed value, 那就是一個觀察值的 score. 可能意義不大。
相形之下 Sample score 中的 Zi 比較是實際 observed values. 比較少用 E(sample score). 當然也可以定義為 Z1, Z2,… Zn 的 joint pdf.
In summary, 如果要算 Expectation score, 多半是用一個 random variable Z. 如果是算實值的 score, 多半是用 sample score (deterministic).
同樣的道理也可以 apply to Hessian (RV) and Sample hessian (deterministic); 或是 (Fisher) Information and Sample information? (有 Sample information 嗎?) 嚴格來說 Fisher information 是取 expectation value, 本身已經是 deterministic function of θ. 並非 random variable. 當然也沒有所謂的 sample information. 不過我們就類推 Sample information = -1 * Sample hessian, 因為 expectation of a value = value.
從大數法則來看: Information ≈ Sample information / n.
log likelihood l(θ;Z) 基本上大多是 concave funciton (當然有例外,特別是在 mixture pdf), 所以原則上 Hessian and Sample hessian: H(θ; Z) ≦ 0
反之 information matrix J or Fisher information I(θ) 是 covaraince matrix (or variance for single variable), 都是 positive or postive semi-definite matrix. 後面証明因為 E[Score] = 0, 因此 information matrix 也就是 Score 的 variance.
最神奇的是 J (or I a KxK matrix) = Cov[ s(θo; Z) ] = E[ s(θo;Z) s(o;Z)’ ] = - E[ H(θo; Z) ] !! 証明見 Appendix.
Fisher Information 的物理意義是什麼?
首先 Fisher information 是 Score (function of Z) random variable 的 variance (or covaraince matrix).
Fisher information 只是 function of θ. Z, as a random variable 在做 expectation 計算中消失。
所以 given θo and Z 的 pdf. 可以很容易算出 Fisher Information 的理論值。
實務上則非如此。因為 θo 是我們要 estimate 的參數!
###
(1) 我們只有 given samples and Z 的 pdf. 如何推算 Sample information?
(2) 另外一個問題是 Fisher Information 為什麼重要?
先說結論 (2): Sample Information 就是用 Zi 估計 θo 所得到 θest 的 variance (or covaraince matrix) 的倒數, i.e. Cov[θest - θo]^(-1). 所以 Information 愈大,θest 就愈接近 θo. 如何增加 Sample information, (1) 增加 samples n; (2) 增加 Var(Score^2)
回到第一個問題,沒有 θo, 如何推算 Sample information. 雖然沒有 θo, 但有 n 個 samples, Zi.
顯然解法是先用 Sample Zi 估計 θo as θest.
Method 1: 用 θest 代入 Fisher Information 可以得到 (unit) Fisher information. Sample information = n * Fisher information
Method 2: 用 θest and Zi 計算 Sample score, Sample hessian, and Sample Information. 當然我們假設 Sample information = -1 * Sample hessian. 從另外一個角度想,就是把 Z1, Z2, .. Zn 想成一個 joint PDF or likelihood function. 同樣可以算出 Fisher information. 代入 θest 就是這個 sample (Z1, Z2, …, Zn) 的 Sample information.
直觀來說 Method 1 和 Method 2 在 n 很大時,會趨近相等(by 大數法則)。但在 sample 不多時 (e.g. n = 2) 如何?
結論似乎相同。只要是 Z1, Z2, .. Zn 是 IID.
可以參考本文 (p41. variance estimation) 給出三個方法。Method 1 對應 (3); Method 2 對應 (1); 還有 (2) 是用 sample score 平方 (or empirical variance of score) 來算。
實際(物理)上的 Information 當然還是有 n 個 samples 的 Sample information. 可以看到 samples 愈多,Sample hessian 就愈負。也就是 Information 就愈大愈多。 (Sample) Information ~ n.
如果我們畫 log likelihood function of n-samples w.r.t θ (e.g. of Normal distribution), 會看到一個 concave function of θ.
在 Sample score = 0 的 θ, 也稱為 θmle. 對應的是 log likelihood function 的頂點。Sample information 對應的就是頂點 (需要是頂點嗎? 還是每一點都 ok?) 的曲率。顯然 n 愈大,sum of log likelihood function 在頂點的曲率也愈大。曲率的倒數就是 θest 的準確度 or varaince. 這是只有在 MLE 適用? 或是非 MLE estimator 也適用?
Examples
我們用 normal distribution with u = θ (mean is the estimated parameter) and known σ=1 (variance) with two sample Z1, Z2 為例。
很直觀 u ≈ θest = (Z1+Z2)/2

Fisher information of a Normal distribution = 1 assuming 𝜎 = 1.
Method 1: Fisher information = 1 => Sample information = 2 不管 θest 是多少。
Method 2: 如果代入 Z1 and Z2 into Sample hessian = hessian(Z1) + hessian(Z2) = -2 (也是和 Z1, Z2 無關). 因此 Sample information = -1 * -2 = 2. 結果和 method 1 相同。
其實只要 Fisher information 和 θ 無關 (如 normal distribution, exponential distribution). Method 1 and 2 結果會一樣。
再來看 Bernoulli distribution. 參考 http://www.ejwagenmakers.com/submitted/LyEtAlTutorial.pdf

Method 1: θest = 1/2(Z1+Z2) => I(θ) = 1/[θ(1-θ)]
=> Sample information = 2 * I(θ) = 2 / [0.5(Z1+Z2) * (1-0.5(Z1+Z2))]
Z1, Z2, θest, Sample information (n=2) 分別如下:
0, 0, 0, ∞
0, 1, 0.5, 8
1, 0, 0.5, 8
1, 1, 1, ∞
Method 2: 因為 Sample information = (-1) * Sample hessian = (-1) * [ sum of each hessian ]
Z1, Z2, θest, Sample information (n=2) 分別如下:
0, 0, 0, ∞
0, 1, 0.5, 8
1, 0, 0.5, 8
1, 1, 1, ∞
似乎只要 θest 相同,method 1 and method 2 的結果一樣。這好像 make sense. 因為只要 I(θ) 是從 pdf/log likelihood 算出且 IID. ?
什麼時候會 Fisher information*n 和 Sample information 不同? 就是在 Fisher information 是用真的θo 得出 (hidden variable), 但是 sample information 卻是從 Z1, Z2, .., Zn 得出。因為 Fisher information 是 weighted (by pdf) information. 但是 Sample information 是一次的 samples (Z1, …, Zn) 得出的 Fisher information.
參考本文的例子。
所以 consistent estimator 就是讓 θest 和真實的 θo 趨近: consistency
以及 efficient estimtor 就是 Sample information under θest 趨近 Fisher information (under θo) * n: efficiency
另外還要加一個 asymptotic normality 條件。
Fisher 在 1925 從 consistency 和 efficiency 角度提出 maximum likelihood estimator (MLE) 是 consistent and efficient estimator. 而不需要用到 sufficient statistic. 因為有些 distribution 的 sufficient statistic 不存在。但是 MLE 仍存在。 Rao 在 1963 証明這點。
Asymptotic Normality of Maximum Likelihood Estimator
回到實務面。一般我們只有 Z1, Z2, …, Zn observed samples 以及 Z random variable 的 PDF.
先從 Sample Score (deterministic function of θ) = 0 得出 maximum likelihood estimation, θn.
因為 MLE 是 consistent estimator, 在 n 夠大時 θn → θo. 可以做 1st order Taylor expansion.


下面重組並引入 n 做為 normalization constant. 在 Sample hessian 部份被 normalized to unit Sample hessian.
對應的 n 被分為 √n * √n. 一個放在 Sample score 的分母,另一個放在 estimated error 的分子。
接下來就是最精采的部份:

這應該容易看出。藉著 ergodic 特性,time average 等於 expectation value.

再來就不是那麼直覺,Normalized sample score (by √n) 會收歛到 zero mean, variance 為 Fisher information 的 normal distribution.

Zero mean 很容易了解。因為 E[Score] = E[s(θo;Z)] = 0

同樣 by ergodic property, Sample score 的平均值 (/n), 會收歛到 E[s(θo;Z)] = 0. 即使 * √n = 0
另外 Var[Score] = Var[s(θo;Z)] = J. 所以 variance 會收到 √n 的 boost. 變成 n/n^2 = 1/n. 也就是 unit variance 的平均值。
By Central Limit Theory (CLT), 可以 show 最後收歛到 N(0, J).

| 因此 estimated error, | θn-θo | , 角度是反比於 √n; 從 θn variance 角度則是反比於 n |
|θmle-θo| 收歛的速度和 √n 正比。或是 θmle 的 variance 和 n 成反比,也和 Fisher information 反比。
Rao-Cramer Bound or Inequality
注意 psd 是 positive semi-definite. V(θ) = Var(θ)
前文已提到 MLE 是 Var(θmle) → (nJ)^(-1). 因此 MLE 比其他的 unbiased estimator 更 efficient!
The proof is in appendix.
Appendix
上述用到的幾個等式的証明

可以看到是用 random variable Z 的 Score and Hessian (非 Sample score and Sample hessian).
同時用 θo 暗示 give a fixed θ. 注意 θo 不需要是 θmle, for any θo 以上等式都為真。
Proof of Score equality


Proof of E[Score] and Information equality


Proof of Rao-Cramer Inequality
Use DK divergence >= 0 to prove.
Proof of MSL Consistency
Relationship to KL divergence
, sufficient statistics, score, Fisher information, Rao-Cramer bound 等都和此有關。
∂L(θ;X)/∂θ = 0. 為何 pdf 的 maximum point 可以用來做 estimation. 乍看 make sense, 但如果 pdf 有兩個 max, 或是 uniform distribution? 結果如何?
Julia Code Snip
Why Julia?
我非常希望能有一個像 Matlab 的 programming tools:
- Cross platform (Windows, Mac, Linux)
- Free and very easy to install and launch (Matlab 顯然既非 free 也不容易 install 和 launch)
- 非常直覺的數學格式 (scaler and vector) 支持 (Python is out!)
- 支持 math symbol or unicode symbol, 最好是 code 而不是 comment (e.g. Jupiter)
- 完整的 library, e.g. linear algebra, DSP, distribution, etc.
- 非常重要是 graphics 的功能! e.g. Matlab, Matlibplot,
Julia 是我很看好的 candidate. 不過 Julia 有幾個問題:
- Syntax 變化快:Julia 0.7 之前 support “linspace()”, 後來完全不 support!! 這讓很多舊 code 無法直接使用。同時影響 Copilot 之類 AI low code, no code 在 Julia 的有用性。
- 同一個功能有不同 packages. 例如 plot 有四五種不同 packages: PyPlot, Plots, Gadfly(?)
Latex Math Symbols
In the Julia REPL and several other Julia editing environments, you can type many Unicode math symbols by typing the backslashed LaTeX symbol name followed by tab. (e.g. \pi [tab])
Plots
第一個問題是要用 PyPlot or Plots package! 建議使用 PyPlot 因爲和 Matlab, Python 的使用經驗一致!
PyPlot: Plot sin with axis/range
1 | |
Plots: Plot sin with axis/range
1 | |

Plots: Add a new curve
1 | |

Plot normal distribution
1 | |

Amend:
Plots 好像更 general? 可以看 backend 是否是 PyPlot 決定是否用:
1 | |
Plots 如果在 VS code 不 work, 可以強迫 display
1 | |
Math Stat I - Likelihood, Score Function, and Fisher Information
Time_entropy
Information –> measurement of causal relationship?


